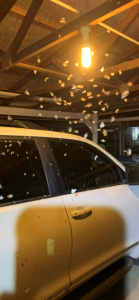
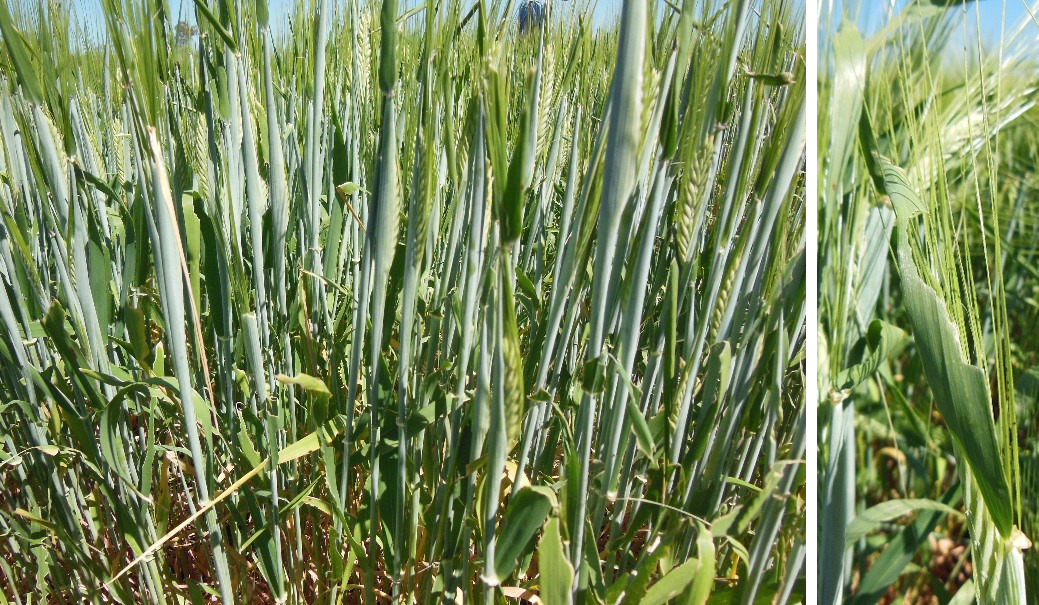
Armyworm infestations of barley crops, in particular, are being reported from southern NSW to the Darling Downs. Large numbers of moths are also being seen around lights at night. It is not unexpected that armyworm would be abundant this spring as some of their source areas (Channel Country, North Western Queensland) would have received significant rainfall or flows earlier in the year.
The density of infestations in crops this season is high, around 10-30 larvae/square metre, based on beat sheet sampling.
The available threshold for armyworm relates specifically to the economics of controlling infestations to prevent head-lopping (7 heads/larva/sqm or 70 kg grain lost/ha for every larva/sqm). Head-lopping typically occurs as the barley/wheat starts to senesce and the leaves dry, making them unpalatable to armyworm larvae. In desperation, the larger larvae will feed on the last remnants of green on the plant – the nodes that connect the head to the mainstem. This results in the severing of the stem and thus ‘head-lopping’.
Deciding whether an infestation of armyworm requires treatment to prevent head-lopping requires an assessment of the rapidity of crop senescence and armyworm population structure. If there are no large larvae in the crop as it dries down, the risk of head-lopping is low.
Of more immediate concern is the extent of potential defoliation that might be caused by these large numbers. Armyworm feed on the leaf margins, producing a characteristic scalloping. The amount of damage they will do to the upper leaves (flag, flag-1, flag-2) is of particular concern as the grain is filling.
There is no definitive answer to how much defoliation will occur with a given number of armyworm per square metre because feeding varies with canopy size, leaf quality and larval size. What is known from observing armyworm infestations in barley, is that the upper leaves will be fed on, even when there is still plenty of green leaf lower down. Data (Figure 1) from trials at North Star some years ago show the progression of defoliation (% leaf consumed) over time. The flag, flag-1 and flag-2 were fed on at a similar rate, but the extent of defoliation varied considerably between sites (even with similar numbers of larvae in the crops).
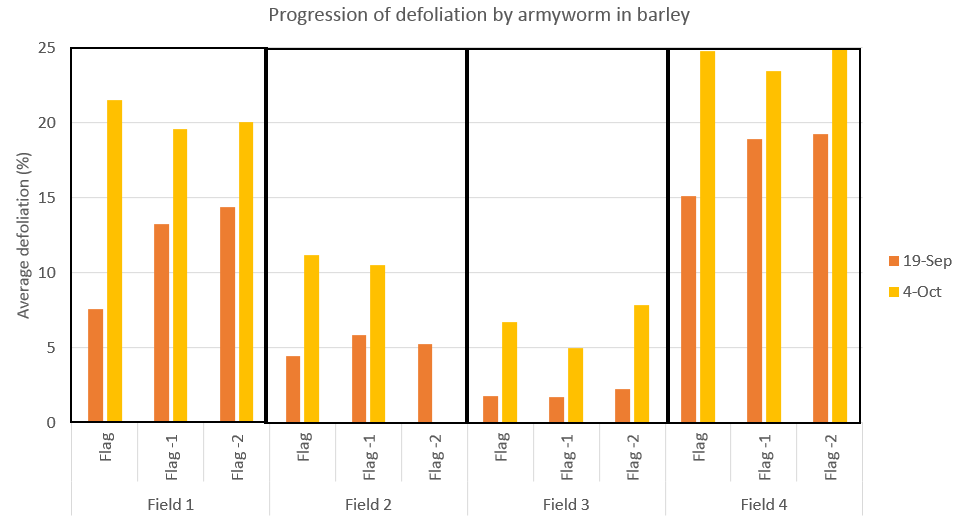
Figure 1. Progression of defoliation (% leaf area loss) caused by armyworm in barley in four fields, North Star, NSW.
Given the significant impact that loss of these leaves can have on both yield and grain quality, the current recommendation is to control armyworm if defoliation of these leaves is observed.
This approach will result in earlier control of armyworm that might normally be the case, and raises questions about whether there is time for a subsequent egg lay and infestation, requiring a second treatment as the crop matures. The simulations (below) illustrate the rate at which armyworm develop from egg to damaging larvae (instars 4-6) in different regions in spring, and show it is unlikely that a second, damaging population will eventuate before the crop senesces.
Monitoring for armyworm
Sweep nets used to be the weapon of choice for monitoring armyworm in cereal crops, but in recent years beat sheets have become more popular. However, in order to accurately assess the current and future risk of defoliation and/or head-lopping, knowing the population structure is essential. Figure 2 shows how important it is to include digging (examining the soil and leaf litter around the base of the plants) in your assessment of the armyworm infestation. Large larvae (L5-6) consume around 80% of the total larval intake, which is why a good assessment of that component of the population is vital for decision making.
Larger larvae tend not to feed in the canopy during the day, which is why relatively few are sampled by either the beat sheet or sweep net. The beat sheet is better able to dislodge larvae from in the canopy, which is why it catches more than the sweep net.
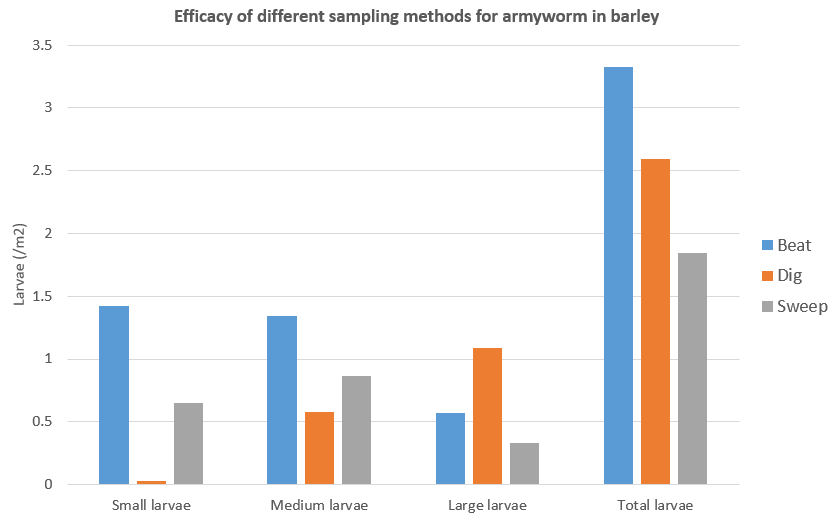
Figure 2. Numbers of larvae found using different sampling methods indicate that while beat sheeting is the most effective indicator of small to medium larvae, large armyworm larvae are more likely to be found around the base of plants.
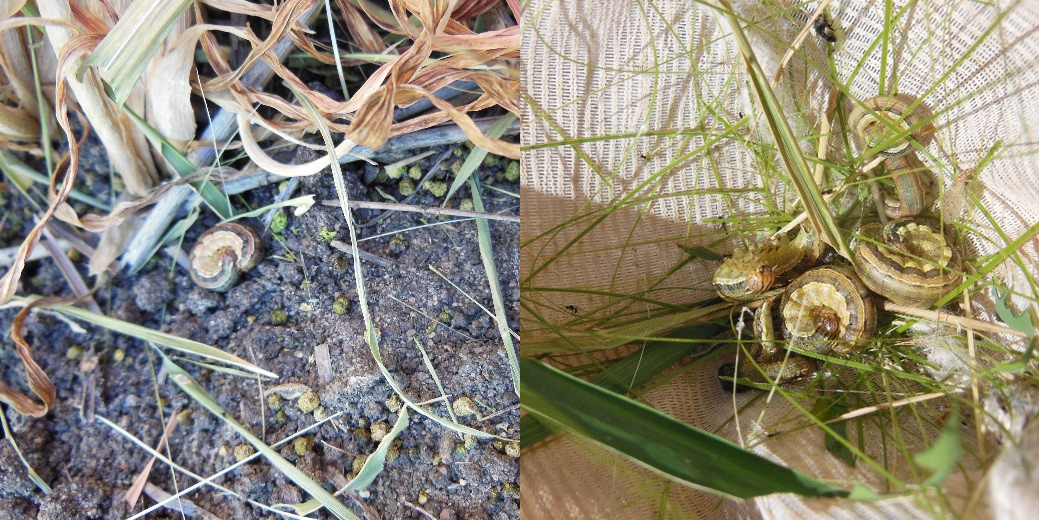
Armyworm frass is a good indicator of activity in the crop; larger larvae which may be sheltering in the soil and leaf material on the ground.
Forecasting armyworm development
The simulations below illustrate the rate of development of small, medium and large larvae observed in the crop on 1 August, for Dalby, Moree, Dubbo and Breeza.
The simulation uses average temperatures (last 15 years) for each of the locations. Each of the black dots denotes the beginning of a lifestage (egg, L1, L2, L3, L4, L5, L6, Pupa) and in these simulations, small = L2, medium = L4 and large = L6.

