Monitoring for insects is an essential part of successful integrated pest management programs. Correct identification and accurate assessment of pest and beneficial presence in the field at various crop stages will ensure appropriate and timely management decisions.
Good monitoring procedure involves:
- Knowledge of pest and beneficial species likely to be present. As well as visual identification of various life stages, you need to know where on the plant to look and what is the best time of day to get a representative sample.
- Awareness of the critical crop development stages. Focus monitoring at crop stages likely to incur economic damage. Critical stages may include seedling emergence and flowering/grain formation.
- Good sampling and recording techniques. Monitor a representative portion of the crop as pest activity is often patchy. Defined sampling parameters (e.g. number of samples per paddock and number of leaves per sample) helps sampling consistency and allows comparison over time (increases or decreases in populations levels). Actual sampling technique depends on crop type, age and paddock size, and is often a compromise between the ideal number and location of samples and what is practical regarding time constraints and distance covered.
- A healthy dose of common sense. Random sampling aims to give a good overall picture of what is happening in the field. Any obvious hot-spots should be investigated, but the relative proportion of hotspots in a field must be kept in perspective with less heavily infested areas. For pests where populations can be very high (aphids, mites, whitefly etc) an estimate of infestation level or a presence/absence system may be more appropriate than trying to count individuals. Also be aware of environmental conditions, as sometimes damage from environmental stress can be mistaken for insect activity.
Sampling methods
While the recommended method for sampling most insects in row crops is the beat sheet, visual checking in buds and terminal structures may also be needed to supplement beat sheet counts of larvae and other more minor pests. Visual sampling will also assist in finding eggs of pests and beneficial insects.
Sweep netting is common in crops with tight rows, and bucket sampling can be used for pests that occur in specific locations on the plant such as midge in sorghum heads.
Beat sheet
A beat sheet is the main tool used to sample row crops for pests (particularly caterpillars, bugs, aphids and mites) and beneficial insects.
A standard beat sheet is made from yellow or white tarpaulin material with heavy dowel attached to each end. Beat sheets are generally between 1.3-1.5 m wide by 1.5-2.0 m deep, and the beat stick a 1m length of dowel. The width catches insects thrown out sideways when sampling and the sheet´s depth allows it to be draped over the adjacent plant row to prevent insects being flung or escaping in that direction. The use of smaller beat sheets, such as small fertiliser bags, reduces sampling efficiency by as much as 50%.
Using a beat sheet:
- Place the beat sheet with one edge at the base of plants in the row to be sampled.
- Drape the other end of the beat sheet over the adjacent row or up against the base of the next row for wide row spacings.
- Holding the one metre stick at both ends, use it to shake the plants in the sample row vigorously 5-10 times in the direction of the sheet to dislodge the insects onto the beat sheet.
- Record type, number and size of insects found on the sheet.
- Repeat at another 4 non-consecutive lengths of row within a 20m radius (5 beats = 1 sample unit) and sample a total of 6 units per field.
While progressive sampling can be used for some pests (after a minimum number of samples, counts are declared as definitely over/under the threshold, or sampling continues if counts are within a threshold range), reducing the number of beat sheet shakes per site greatly reduces sampling precision. The more samples that are taken, the more accurate is the assessment of pest activity, particularly for pests that are patchily distributed.
Sweep net
Sweep net sampling is less efficient than beat sheet sampling in row crops and can underestimate the abundance of pest insects. Sweep netting is useful if the field is wet, when sampling for flighty insects, or in crops with narrow row spacing (including many cereal crops). Sweep netting works best for smaller pests found in the tops of smaller crops (e.g. mirids in mungbeans), is less efficient against larger pests such as pod-sucking bugs, and it is not practical in tall crops with a dense canopy such as coastal or irrigated soybeans. At least 20 sweeps must be taken along a single 20 m row.
Other sampling methods
- Visual checking is not recommended as the sole form of insect checking, however it has an important support role in some situations, e.g. examining flowers or terminals for eggs or small larvae, checking leaves (particularly lower surfaces) for aphids, mites and silverleaf whitefly, or digging below the soil surface with a trowel or shovel to assess soil insect activity. Visual checking of plants in a crop is also important for estimating crop stage, pod retention and other agronomic factors.
- Bucket sampling is similar to beat sheeting, but individual plant parts (e.g. sorghum heads) are shaken into a bucket to dislodge insects.
- Suction sampling is a quick and relatively easy way to sample for mirids, but it is expensive, noisy, sucks up bees and flowers and has relatively low sampling efficiency.
- Bait station sampling can attract pests that are otherwise difficult to monitor, such as wireworm, earwigs, crickets or snails/slugs.
- Monitoring with traps (pheromone, volatile, or light traps) can provide general evidence on pest presence and the potential timing of peak egg lay events for some species but is much less accurate than in-field monitoring of actual pest and beneficial numbers. Read more about pheromone traps.
- eDNA analysis detects pest DNA in collected samples of material, with the potential to develop quick and accurate tests for a range of invasive species. Find out more at EcoDNA.
Timing
While a manager needs to be aware of what is happening throughout a crop’s growth, pest monitoring is often targeted at specific times of day, certain crop stages, or adapted to the circumstances. For example:
- Pulse crops are at greatest risk from insect attack from budding onwards, so check weekly during the vegetative stage and twice weekly from the start of budding onwards. Cereal crops are prone to establishment pests, particularly in southern regions.
- Caterpillar pests are not very mobile within the canopy, so checking at any time of the day should report similar numbers. Pod-sucking bugs often bask on the top of the canopy during the early morning, and are best sampled then.
- Temperature should be considered when planning sampling. Hot weather usually increases insect activity.
- Some insects are more flighty in the middle of the day and therefore more difficult to detect when beat sheet sampling. Others (e.g. mirid adults) are flighty no matter what time of day so it is important to count them first.
- In very windy weather small insects are likely to be blown off the beat sheet.
- Some pests are more favoured by wet or dry seasons than others or are more common after certain weather events (e.g. red-shouldered leaf beetles swarm after heavy rain.
- Heavy rain can cause a reduction in the numbers of some pests (e.g. aphids). Using the beat sheet to determine insect numbers is difficult when the field and plants are wet.
Adjusting for consistency
Row spacing
Most thresholds are expressed as pests per square metre (pests/m2). Hence, insect counts in crops with row spacing less than one metre must be converted to pests/m2. To do this, divide the ‘average insect count per row metre’ across all sites by the row spacing in metres. For example, in a crop with 0.75 m (75 cm) row spacing, divide the average pest counts by 0.75.
Species and/or lifestage
Not all podsucking bug species do the same level of damage. Threshold levels in mungbeans and soybeans are calculated using green vegetable bug (GVB) adults, and other species and juvenile insects need to be converted into adult green vegetable bug equivalents (AGVBEq) to allow comparison against the threshold. See podsucking bugs economic thresholds for more information.
Field mortality
In chickpeas, newly hatched larvae are usually ignored in the threshold calculations as they (i) do relatively little damage and (ii) have a relatively low survival rate, and small larvae are assumed to have about 30% mortality.
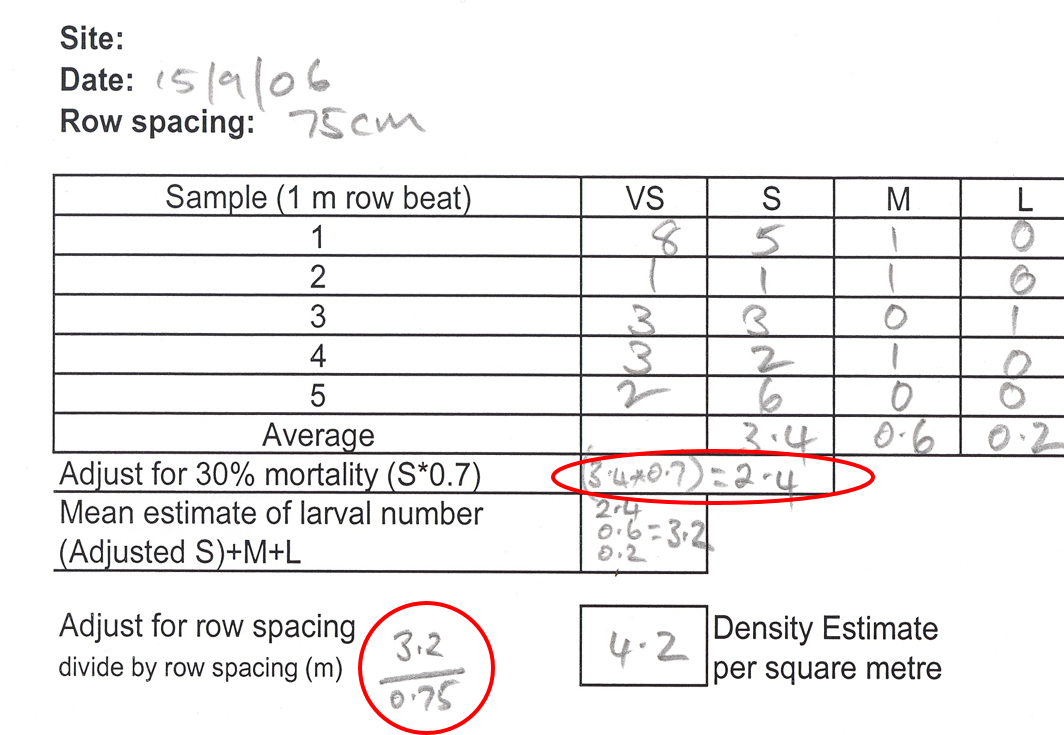
An example of a field check sheet for chickpeas, showing adjustments for field mortality and row spacing
Keeping good records
Accurately recording sampling results is critical for good decision making and allowing review of the success of control measures. Information collected should include:
- numbers and types of insects found (including details of adults and immature stages)
- insect size (particularly important for juveniles)
- date and time
- paddock ID
- crop stage
- any other relevant information (e.g. row spacing, weather conditions, and general crop observations).
Consider putting the data collected into a visual form (such as a graph) that enables you to see trends in pest numbers and plant condition over time. Seeing whether an insect population is increasing, static or decreasing can be useful in deciding whether an insecticide treatment may be required, and if a treatment has been effective. If you have trouble identifying damage or insects present, keep samples or take photographs for later reference.
Keeping spray records is a legal requirement for most products, although the details can vary between states. Records of spray operations usually include:
- date, start/finish times and location
- details of person applying pesticide
- conditions (wind speed, wind direction, temperature, presence of dew and humidity)
- crop details
- product(s) used (including any additives)
- amount of product(s), volume applied per hectare, and number of hectares sprayed
- method of application including nozzle types and spray pressure
Check the product label for any additional or specific record-keeping requirements.
Further information
- Spray drift and recording requirements (APVMA)
- Beatsheet videos:
- How to use a beat sheet (CottonInfo video)
- What’s on my beat sheet? (CottonInfo video)